
Q3 2026 Review | Market Update
ARTICLE AUTHOR

SHARE:
The third quarter brought a sharp change in mood across financial markets. At the start of the year, investors expected a steady environment of falling interest rates and cooling inflation. Today, headlines are dominated by the highest 10-year Treasury yields in more than two decades, renewed rate hikes from the Federal Reserve, and worries that inflation is back. Higher oil prices tied to the Iran conflict, along with stronger-than-expected economic growth, have changed the outlook in only a few months.
Our view is that the reality underneath the headlines is more nuanced, and in several respects more encouraging, than the current narrative suggests. Much of today’s inflation pressure is driven by commodities and is likely to be temporary. The year-over-year math behind inflation readings could work in our favor by next spring. Rising rates also have mixed effects: they create headwinds for borrowers but put more income in the pockets of savers and bond investors.
In this letter, we walk through what has changed in the bond market and why, how we expect inflation to evolve over the short and long term, and how rising rates affect different parts of the economy. We also look at the unusual gap between diesel and gasoline prices. Finally, we discuss a growing gap in the stock market, where a handful of AI-related companies are masking broader weakness beneath the surface of the S&P 500.
Interest Rates
The interest rate on the 10-year US Treasury bond is generally the most widely watched number in the bond market. This quarter the 10-year yield reached 5.3%, its highest level since 2002 (Figure 1). The Federal Reserve also raised the Federal Funds Rate by a quarter percentage point, and the market now expects three to four more rate hikes over the next year1.
That can sound concerning, and current headlines are pushing that narrative. But compare today’s sense that rates are out of control with where the bond market stood at the start of this year. In January, the 10-year Treasury yielded 4.2%, and the market expected the Federal Reserve to cut rates twice over the following year1. The bond market in January was almost the opposite of where it is today, so what changed? It was not government spending. The same budget and the same large deficit projections are still in place from nine months ago. The only meaningful changes have been higher near-term inflation projections, driven by rising global oil prices, and higher expectations for economic growth.
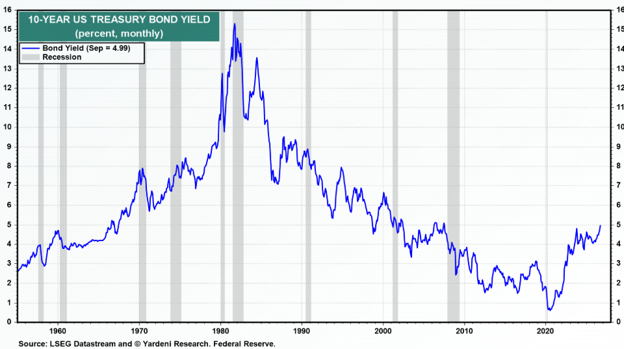
Figure 1 – 10-year US Treasury Bond Yield
Inflation
Higher oil prices tell a very different inflation story in the short term than in the long term. In the short term, inflation will run higher than it has over the past few years, and this temporary increase is what has the market and the Federal Reserve worried. The bad news is that a central bank can do nothing to ease a commodity-driven price spike. It can print more dollars, not more barrels of oil.
The good news comes from the longer-term view. Inflation is measured as the year-over-year percentage change in prices. So even if oil prices hold at today’s levels, by April of next year oil will no longer be adding to inflation (Figure 2). Our base case is that oil prices next spring will be slightly below the roughly $100 per barrel average seen in the first few months of the Iran conflict2. That makes it possible for inflation readings from the second quarter of next year onward to come in below the Federal Reserve’s 2% target. As inflation cools, it could ease the current pressure from rising rates and the concern about another cycle of runaway inflation.
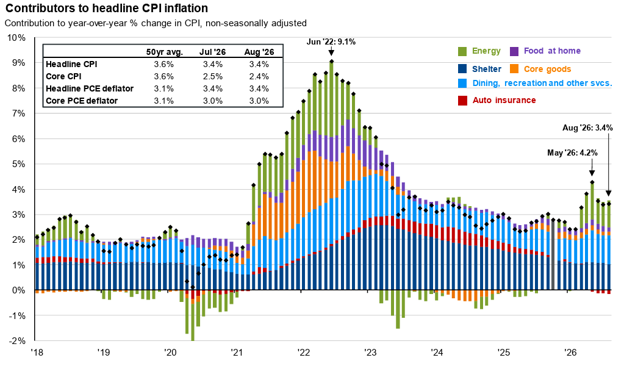

Figure 2 – Contributors to headline CPI Inflation
Interest Rates: Short- and Long-Term Impacts
Rising rates on loans of different maturities, also called different points on the yield curve, affect the US economy and investors in different ways.
Short-term yields are driven mainly by the Federal Funds Rate and mostly affect business and commercial real estate loans. Many of these loans carry floating rates tied to the Federal Funds Rate, which is why Fed rate hikes can slow the economy by raising businesses’ interest costs. For investors, though, a higher Federal Funds Rate mainly means higher returns on money market assets. About $8.5 trillion currently sits in money market accounts, and higher yields put more money in those investors’ pockets (Figure 3). That added investment income could act as an economic stimulus that partly offsets the slowdown on the business side.
Long-term yields are shaped more by market forces. These rates affect borrowing costs for homes, cars, and some larger corporate debt, and their effects are usually felt more slowly than short-term rates. If rates stay at current levels, consumer spending on cars and homes could slow. For investors, starting yields are highly correlated with future bond returns. As yields rise, bonds may begin to compete with other assets, such as stocks, for investment dollars.
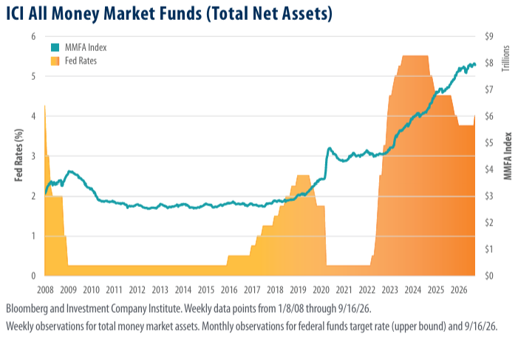
Figure 3 – Money Market Funds Total Assets
Oil vs Diesel Spreads
One interesting inflation development is the gap that has opened between the price of crude oil and gasoline and the price of diesel (Figure 4). It shows up in the headlines and every time you drive past a gas station. Rising global oil prices are only a small part of the cause. The bigger driver is the loss of global diesel refining capacity, mainly in Russia, which has created a shortage of this fuel3. The shortage has also coincided with peak summer driving season and broadly stronger economic activity.
This data point offers two positive takeaways. First, a global economy strong enough to push diesel prices higher confirms what other growth numbers are showing. Second, the US is exporting diesel at a large premium, which supports the economy here at home. US refineries have been running near maximum capacity since about 2022 to meet this demand4. Diesel use usually declines in the winter months, so the current imbalance will likely start to ease over the next several months.
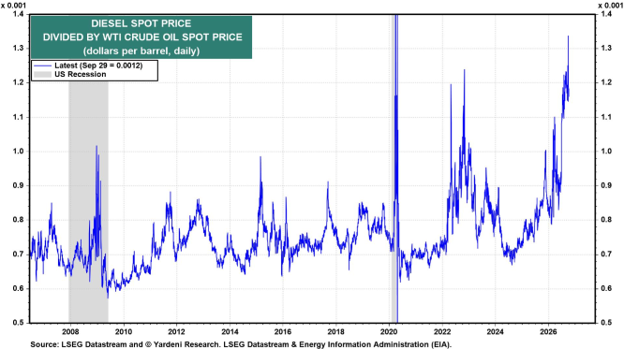
Figure 4 – Diesel spot priced divided by WTI crude oil spot price
Stock Market Concentration
Like the bond market, the stock market is a tale of two very different stories. On the surface, the S&P 500 looked unaffected, rising 2.3% for the quarter, starting at 7478 on July 1st and closing at 7651 on September 30th 6. Much of that gain came from the index’s ten largest companies, which now make up 41% of its weighting and are all AI-related (Figure 5)5. The equal-weighted S&P 500, which gives every company the same weight, fell 1.9% for the quarter7.
Beneath the surface, companies broadly weakened, and they did so in the same part of the quarter when interest rates began to rise. Higher rates tend to slow economic activity at the margin, and with it corporate earnings. That is what the decline in non-AI companies reflects. Even though it doesn’t show up in the headline index, rising rates are already affecting stocks broadly. For now, the market seems to believe the AI trade is immune to higher rates and changes in economic activity. When you follow the S&P 500, keep in mind that it now behaves more like a concentrated AI basket than the broad market indicator it has traditionally been.
We believe there are still reasons to be optimistic about the broader stock market, despite the recent weakness in Q3. The data so far seems to support the economy can handle these higher rates and oil prices. More reasonable valuations in the market ex-mega cap companies could allow for those equities to perform even without perfect conditions.
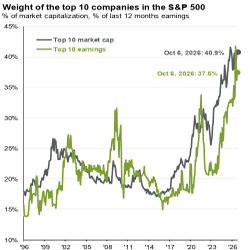

Figure 5 – Weight of the top 10 companies in the S&P 500
Jimmy Kelley
Chief Investment Officer
Caliber Wealth Management
1 https://www.cmegroup.com/markets/interest-rates/cme-fedwatch-tool.html
2 https://www.eia.gov/dnav/pet/hist/RWTCD.htm
4 https://www.eia.gov/dnav/pet/hist/LeafHandler.ashx?n=PET&s=MOPUEUS2&f=M
5 https://www.spglobal.com/spdji/en/indices/equity/sp-500/#data
6 https://finance.yahoo.com/quote/%5EGSPC/history/
7 https://www.morningstar.com/etfs/arcx/rsp/performance
This letter is provided by Caliber Wealth Management, LLC (“CWM”), an SEC-registered investment adviser, for informational purposes only. Nothing in this letter is a recommendation to buy or sell any security, investment strategy, or market sector, or individualized investment, tax, or legal advice. The opinions expressed reflect the views of Caliber Wealth Management as of 10/14/2026 and are subject to change. This letter contains forward-looking statements, projections, and estimates that are based on current assumptions and are subject to risks and uncertainties, and actual results may differ materially. No forecast or projection is guaranteed. Certain information, data, and charts in this letter come from third-party sources believed to be reliable but Caliber Wealth Management does not guarantee its accuracy or completeness. Third-party content is used with attribution and remains the property of its respective owners.
The S&P 500 Index is an unmanaged, market-capitalization-weighted index of 500 large-capitalization U.S. companies. The S&P 500 Equal Weight Index includes the same companies, each given an equal weight. Index returns do not reflect fees, expenses, or taxes, and investors cannot invest directly in an index. Past performance is not indicative of future results. All investments involve risk, including the possible loss of principal.
A copy of CWM’s current Form ADV Part 2A, Form CRS, and privacy policy is available upon request or at caliberkc.com.


